Overcoming widespread poverty and inequality is not just a moral imperative. It is key to political and economic development. Social exclusion acts as a drag on sound and sustainable economic growth by preventing large segments of the population from fully contributing to the formal economy. And even if formal political rights exist on paper, social exclusion fundamentally undermines meaningful political participation. Social exclusion leads to de facto disfranchisement, deprives individuals and groups of equal opportunities to voice opinions, organize and campaign, and precludes meaningful political activity for some segments of society.
While the connection between social exclusion and the quality of a political regime is hardly disputable, the correlation between social exclusion and the stability of political regimes is the focus of increasing debate.
Does the increase in social exclusion or its persistence lead to political instability? Two indices published regularly by Bertelsmann Stiftung, a private, independent German foundation and think tank, have started to look at this question. We use a database of the status of political and economic reform and the quality of governance in 128 developing countries (the Transformation Index of the Bertelsmann Foundation—BTI)1 and an evaluation of Organisation for Economic Cooperation and Development (OECD) country reform and challenges (the Sustainable Governance Indicators—SGI)2 that evaluates the governments’ ability to respond to current social, political and economic challenges.
Together, both indices cover policy results and management achievements in 151 countries. They are based on the work of nearly 400 country and regional experts who evaluate political and economic governance, with scores ranging from 1 (very weak) to 10 (very good).3
We have combined the data into three variables for our country set, the first two of which apply to developing and transition countries (BTI scores). We define social inclusion as the level of socioeconomic development (reducing poverty and inequality), the extensiveness of social safety nets (government policies to compensate for social risks and alleviate handicaps), and equal opportunity (the absence of discrimination), political stability (which includes the state monopoly on the use of force), state legitimacy (degree to which the legitimacy of the nation-state is accepted), and conflict intensity (degree of polarization, mass mobilization and political violence). For OECD countries, a slightly different set of SGI scores is introduced under the heading of social justice, which includes poverty prevention, equitable access to education, labor market inclusiveness, social cohesion and nondiscrimination, health, and intergenerational justice.4 (Access the full report at www.sgi-network.org.)
Who Knew?
We start by looking at social exclusion. Despite perceptions to the contrary, the world is not significantly less socially inclusive than six years ago. Even in countries where exclusion has increased, many governments have adapted.
During the past two years, poverty and inequality increased in 17 countries but decreased in 10 countries. In other words, in almost four-fifths of all countries assessed, the socioeconomic conditions remained largely at the same level. Expanding the view to six years shows the same trends: deterioration in 24 countries and improvements in 18 countries. The flip side, though, is that while there was no dramatic net increase in poverty and inequality, many of the countries at the lower end of the spectrum tended to stay there.
Including the other two indicators of social inclusion—social safety nets and equal opportunity—in both time spans demonstrated even more positive results. While a quarter (34) of the governments in developing and transition countries improved their social safety nets during the past six years, only 12 countries showed deteriorating state support for the poor and vulnerable. Most of those, however, went from bad to worse, among them Côte d’Ivoire, Eritrea, North Korea, Pakistan, and Sudan. [SEE FIGURE 1] Equal opportunity likewise improved in 35 countries during the past six years. At the same time, though, discrimination (the inverse of opportunity) intensified in 26 countries.
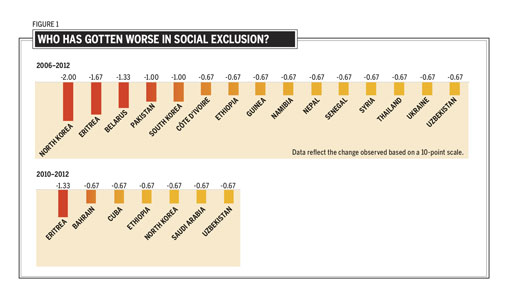
In all, 18 countries experienced a decline in social inclusion. However, only two of those in the past two years (Côte d’Ivoire and Pakistan) experienced an observable deterioration of political stability. Looking over a six-year time span, six out of the 18 countries experienced political instability in the wake of increases in social exclusion: Eritrea (-3.00), Pakistan (-1.67), Bahrain and Senegal (-1.33), Thailand (-1.00), and Guinea (-0.67).
It is hard to track whether a lack of widespread social protest in the politically stable countries showing socioeconomic regression is a result of regime repression (Cuba, Ethiopia, Saudi Arabia, Uzbekistan), or whether political unrest was predominantly associated with a larger political agenda aiming for democratization (Belarus, Guinea, Syria). In some of the politically unstable countries, an intensification of discrimination (for example, against the Shi’ites in Bahrain) or an increase in inequality (for example, between the urban and rural population in Thailand) was an important and perhaps the major factor contributing to political unrest. Nevertheless, there appears to be no direct, linear relationship overall between a sudden decline in social inclusion and an increase in political instability.
Stagnation on the Lowest Levels
After detecting no clear trend toward increasing social exclusion, we next looked at the extensiveness of social exclusion and compared that to political change and social unrest. Here, we see that 69 countries score 4 points or less (out of 10) in socioeconomic development. Regarding social safety nets, many of the same countries measure up poorly. Fifty-eight countries overall score 4 points or lower, indicating only rudimentary or nonexistent provisions for social risk, and in close to half of the global sample, a majority of the population was without protection against poverty.
Of particular concern is Sub-Saharan Africa. In this region, 34 of the 37 countries assessed show symptoms of massive marginalization and serious impoverishment, except Ghana, Mauritius and South Africa. African countries also score the lowest in social safety nets.
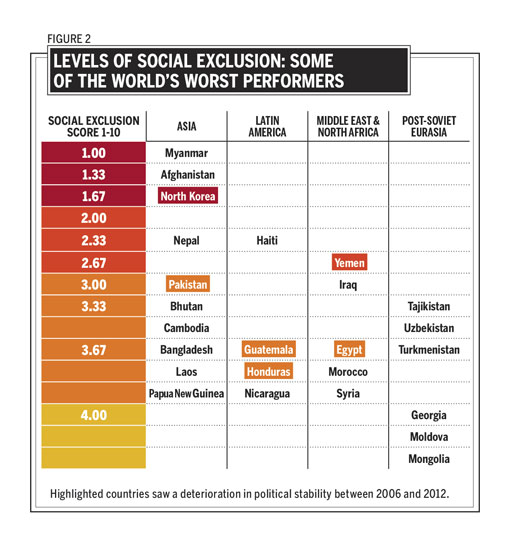
But it is particularly noteworthy that state activities to protect against social risks are almost as limited throughout Asia. With the exception of global outliers like Taiwan (9 on a scale of 1–10), Singapore (8) and South Korea (8), which improve the regional average for all 21 Asian countries assessed, a regional score of just 4.43 illustrates that 10 countries, ranging from Bangladesh (3) and Cambodia (3) to Myanmar (1) and North Korea (1), are incapable of systematically addressing poverty.
Overall, in our three dimensions of social exclusion (low socioeconomic development, weak or ineffective state safety net programs and discrimination), 55 countries score 4 or less on all three indicators combined. Those 55 countries represent more than 40 percent of the states analyzed by the BTI, pointing to potential global risk zones. [SEE FIGURE 2] Within that set of countries, we have highlighted those that have experienced significantly increased political instability in the past six years.
Given such a devastating picture, the question arises: if political instability, observable in all world regions, is not attributable to a sudden, rapid increase of social exclusion, is it instead a result of prolonged, comprehensive deprivation of even the most basic elements of a decent standard of living? Seventeen of the 29 countries with increased political instability over the past six years belong to the bottom half of the BTI countries in terms of levels of social inclusion. This holds true regardless of whether social exclusion worsened.
In other words, what appears to be more important is not a sharp drop in living standards and equal opportunity, but the persistence of social exclusion.
A close look at the Arab world reinforces this early conclusion. It is tempting to trace political unrest in Syria, for instance, to the fact that social inclusion decreased in that country by 0.50 during the past two years. Likewise, Bahrain is the only country of all 128 states in which both indicators for the welfare regime—social safety nets and equal opportunity—decreased during the past two years. But this would not explain the relative lack of political ferment in Saudi Arabia—at least on the surface—which experienced an identical decline in social inclusion.
Economic Growth and Poverty
The global economic and financial crisis had a far less severe impact on most developing countries than originally feared. In fact, developing countries were harder hit by price spikes in raw materials, energy and agricultural commodities in 2007 and 2008 than by the financial crisis of 2008–2009.
The BTI illustrates that 63 countries demonstrated a performance ranging from good (7) to very good (10), as measured by GDP growth, inflation and fiscal policy. Around 70 percent of all Arab, Latin American and East Central/Southeast European countries, as well as about half of all Asian countries, fall under these categories. In contrast, economic performance is considered poor or very poor in just 15 countries, including four Asian countries and six African countries.
Despite the relative stability in economic strength, the data show that countries that experienced economic growth failed to invest sufficiently in their welfare regimes, more specifically, in efforts to improve social inclusion. Figure 3 lists the 35 economies that performed strongest among the 128 developing and transition countries included in the BTI.
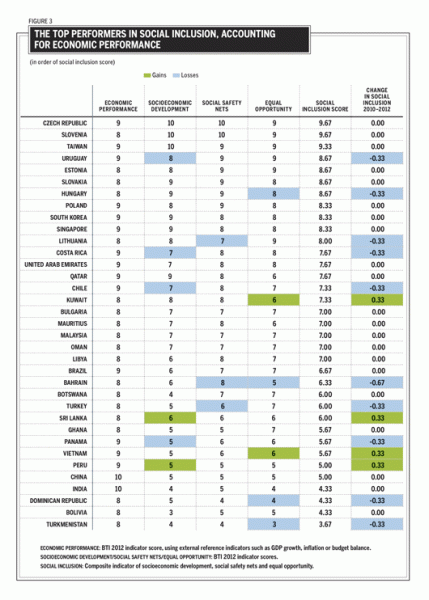
On a positive note, two-thirds of these countries show a high (above 8.5) or at least moderate (above 6.5) level of social inclusion, when we combine our three dimensions of social inclusion. However, almost one-third of these countries showed a decrease in social inclusion, and only four countries improved. Given the strong economic performance of these countries, the failure to improve social inclusion should be seen as stagnation.
Regarding political instability, it is telling to take a closer look at the economically most advanced BTI regions of East Central and Southeast Europe and of Latin America, which form the majority of this listing. Half of these 16 countries experienced changes in political stability. In Latin America, for example, the Dominican Republic formalized discrimination against Haitian immigrants, while conflict stemming from social protests and police violence has increased in Panama and Peru. In Panama, political violence erupted over land disputes and during urban strikes, while in Peru, conflicts have escalated more rapidly amid an “ethnicization” of politics.
Such changes only assess regime stability but already point to the rising intensity of conflict in democracies. When we include indicators on the quality of democracy (political participation rights, rule of law, commitment to democratic institutions), we see even more signs of trouble in Eastern Europe and Latin America. In 15 of the 38 countries in these regions, the quality of the electoral process declined. Freedom of expression is becoming more limited throughout Eastern Europe, and in several countries, the quality of the rule of law either stayed at low levels (Latin America) or deteriorated markedly (Eastern Europe).
Prosperity and Injustice
Even among developed democracies in the OECD, there is considerable variation in the extent to which social justice is developed.5 What is striking, again, is the fact that a country’s rating on social justice does not depend solely on its respective economic strength and prosperity.
The U.S. provides the clearest example. Although still the world’s largest economy, with one of the highest GDPs per capita in the OECD, it lags in almost all areas of social justice. At a rank of 27, the U.S. lands near the bottom of the index, scoring only slightly better than its neighbor Mexico (30) and new OECD member Chile (29). In the individual categories, the U.S. shows especially large deficits in social safety net programs (29th), health (23rd) and access to education (20th).
Educational opportunities depend heavily on social and economic background. The growing gap between rich and poor is a problem throughout the OECD, but the distribution of income in the U.S. is one of the most unequal among the countries examined in the report.
Such a high level of inequality—not only in incomes and wealth, but also in opportunities—provides a fertile ground for social protest movements, especially when social networks function as powerful catalysts. While many Occupy movements in the U.S. and elsewhere do not represent the poor in their rank and file—with many members actually coming from middle-class backgrounds—their emergence does represent a genuine, widespread frustration with the lack of opportunity. And even if the Occupy movement remains fragile, it has already had a strong impact on public discourse.
Such a strong link between social protest and claims for better or “real” democracy can currently be observed in many other OECD states, such as Spain. While the linkage between a decline in social justice and an increase in social protest in the more affluent OECD countries is obvious, none of these demonstrations and protest movements fundamentally affects the political stability of these democracies. That’s in sharp contrast to the systemic crises experienced by some of the poorer countries of the developing world, where social conflict has been accompanied by the deterioration in the quality of democracy, resulting in regime changes in countries such as Madagascar and Thailand, and instability in Senegal and Ukraine.
Social Standards, Political Stability and the Quality of Democracy
In mapping the socioeconomic framework that may contribute to social protest and political unrest, we see differences between restrictive authoritarian regimes (in which social unrest has been repressed or aimed at regime change), weak democracies/moderate autocracies (in which political stability has eroded) and OECD member states (in which protesters have in most cases demanded a reform or deepening of democracy rather than its abolition or greater levels of restrictions). In other words, the potential for social protest to translate into political unrest varies according to regime type because of the way in which protesters direct their anger or frustration.
Admittedly, this is a rough distinction. But it is an important one. It is not simply that low or decreasing levels of socioeconomic development and high or increasing levels of social injustice provoke political unrest. Rather, it is important to examine whether such unrest is allowed to express itself peacefully, whether it is directed against the political regime in power, whether it is targeted at furthering inclusion, or whether it aims at restricting inclusion in a nationalist, populist or xenophobic sense.
To complete the analysis, we look at the country sample of the BTI listing where political stability decreased significantly. [SEE FIGURE 4]
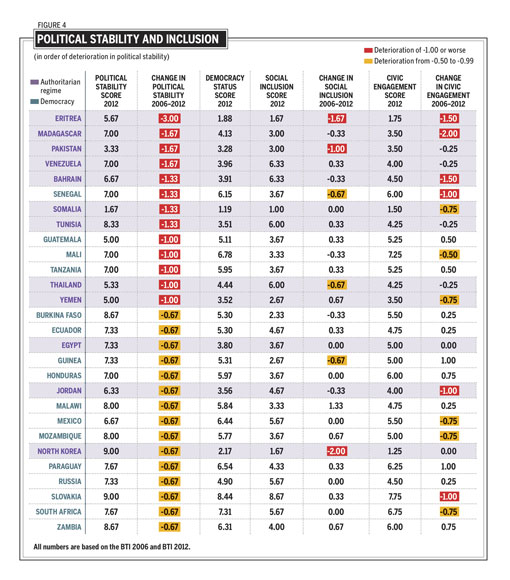
Authoritarian regimes (noted in purple), where political protest is highly restricted, are differentiated from democracies (noted in blue), which range from highly defective ones, such as Russia (which holds free—but not necessarily fair—elections, and where political participation and rule of law is restricted) to stable and advanced democracies like Slovakia.
To assess to what extent civil society can protest, negotiate and participate freely in the political decision-making process, we introduce the composite indicator of “civic engagement.” This consists of the BTI indicator scores for social capital, traditions of civil society, conflict management, and civil society participation.
Of the 28 countries where political stability has eroded, 12 countries are autocracies. Bahrain, Thailand, Tunisia, and Venezuela stand out in this list, because their level of social inclusion is far above the average of all BTI countries (4.85). However, as we have seen in the case of Bahrain (discrimination against the Shi’ites) and Thailand (uneven distribution between rural and urban areas), social inclusion is a major factor with regard to political unrest.
In Venezuela, the regime builds its legitimacy on social inclusiveness but fails on most of the other indicators; in Tunisia (as of January 2011, when the country reports were written), the overall positive socioeconomic assessment still includes mass unemployment among the youth and a rural-urban divide similar to Thailand’s.
However, it is misleading to reduce the revolts in the Arab world to socioeconomic factors, even if, as with Egypt, Jordan and Yemen, social exclusion and impoverishment of large parts of the population remain significant. In those cases, demands for political participation and noncorrupt governance played the dominant role.
Authoritarian regimes with a low level of social inclusion lack what we call input and output legitimacy. The low level of input legitimacy can be derived both from the low overall scores for political participation rights and the rule of law, and from the equally low levels of civic engagement. Even Egypt, for example, with a relatively high score for social capital and civil society traditions, scores just below the global average of 5.08. The low level of output legitimacy (4 or fewer points for the composite indicator of social inclusion) applies to 30 out of the 53 autocracies assessed in the BTI. In that sense, Bahrain, Thailand, Tunisia, Venezuela, and even Jordan belong to the slightly more legitimized half of autocratic regimes.
The lack of legitimization by consent or output explains why political unrest, as it gains space to express itself in an authoritarian setting, tends to demand regime change—and often violently.
Civics, Politics and Stability
In terms of input legitimacy, the 16 democracies that suffered the strongest setbacks in political stability in recent years cover the spectrum from a semi-authoritarian regime like Russia and a highly polarized and unstable democracy like Guatemala to a poor but (until recently) stable democracy like Mali with a high degree of civic engagement.
An interesting example of the ways in which the capacity of a society and the government to channel popular demands can avoid political unrest has long been Mali. The combination of a low level of socioeconomic development and governance shortcomings would make it seem like a sure candidate for political instability. But despite recent events, Mali scores well not only in civil society participation but also in social capital and traditions of civil society. However, the negative trend in the composite “civic engagement” indicator is due to decreasing scores in conflict management relating to deficiencies in addressing the conflict with the Tuaregs in the north, a failure that led to the military coup d’etat in March 2012. Apart from Mali, Senegal and Honduras, the other defective democracies in this sample have neither the social trust, the traditions of civil society, nor governments capable of pursuing effective consensus-building. Social unrest and political instability take on a decidedly more regime-challenging character when the government simply cannot deliver acceptable levels of social inclusion (output legitimacy) on top of its low levels of meaningful civic and political participation and trust.
The results of this mix of low levels of social inclusion and regime legitimacy can be seen in Guatemala and Mexico. The linkage to the high levels of social exclusion is clearly visible. As the BTI Mexico-country report states, “There is […] an obvious connection between the lack of opportunities for the young, associated with weak job creation over the last 20–30 years, and the recruitment capacity of the drug cartels.”
Political stability is slightly more advanced in Ecuador and Honduras, but is challenged by polarization and social conflict. In several of the African countries with increased political instability, our country reports note a combination of government corruption, police violence and fundamental threats to public safety, directly related to socioeconomic conflicts—often crime or disputes about land tenure and distribution. The quality of democracy in these countries is often low, with political participation rights seriously (and increasingly) limited.
All the countries with increased political instability discussed here demonstrate in varying degrees the nexus between social exclusion and political unrest. The concrete shape that political unrest takes, however, depends on the context of the respective country and is directly linked to the quality of democracy and civic engagement.
In closed political systems, the authoritarian rulers either manage to repress unrest or, as was recently seen in the Arab world, are swept away by a wave of demonstrations triggered not solely by socioeconomic demands, but by calls for democratization and better governance. In defective democracies, much depends on the social capital and the willingness of the government to build consensus and cooperate with civil society to keep social protest from escalating.
In consolidating democracies, social demands often are transported by a more or less finely woven network of parties, interest groups and civil society organizations, which act as intermediaries in the political arena and keep social conflicts from escalating.
In that sense, the opening argument is probably best inverted: it is not only the degree of social inclusion that defines the quality of democracy; it is also the quality of democracy that defines to what extent social demands can be negotiated and met.
ENDNOTES:
1. www.bti-project.org
2. www.sgi-network.org
3. www.americasquarterly.org/hartmann
4. All individual indicator scores can be directly linked to the respective chapter in each country report, all of which are freely accessible at the above mentioned web pages. While the SGI combines qualitative (country reports) and quantitative indicators (external statistical data) in determining the scores, the BTI uses external reference indicators only to be contextualized in the qualitative assessment of the country report.
5. For the full Bertlesmann Foundation report please visit www.sgi-network.org.


