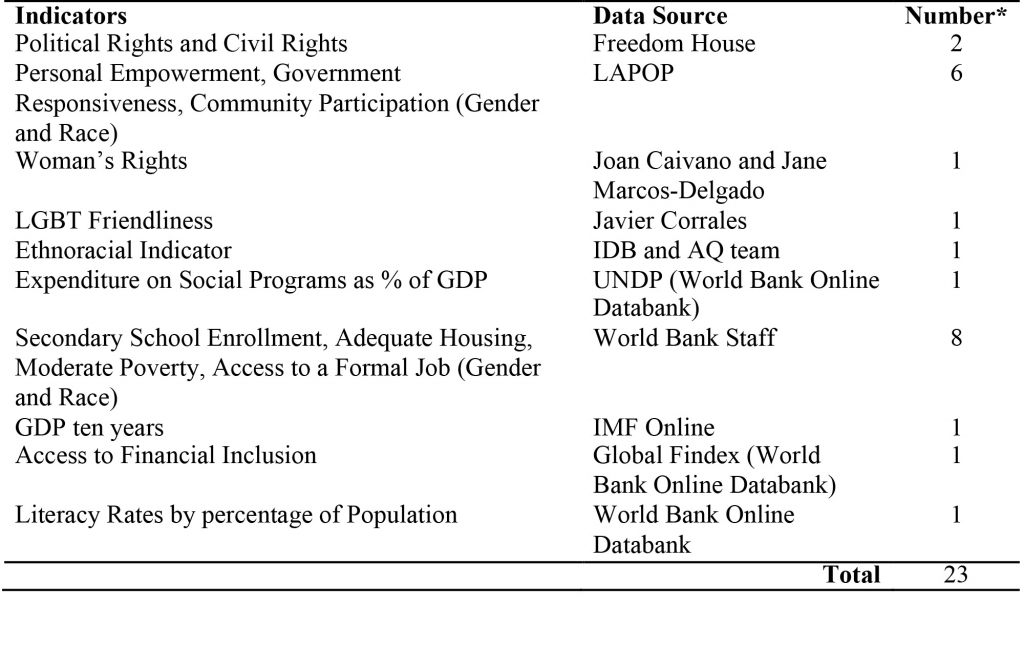
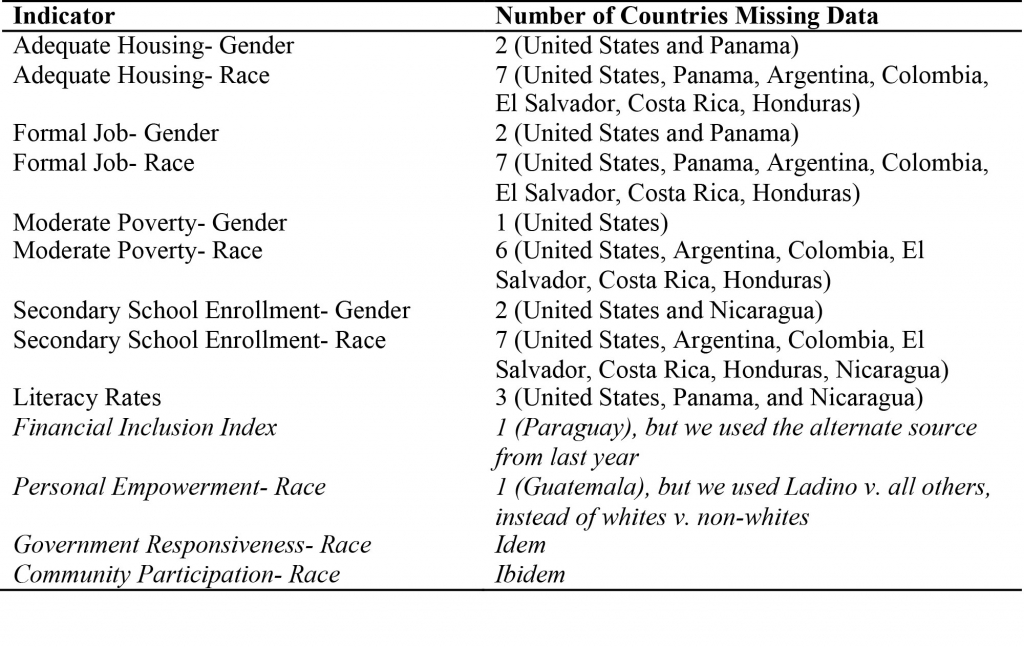
The below describes the source of each of the 23 indicators included in the 2016 Social Inclusion Index. It also explains the few alterations to the scoring of indicators made by the LAPOP team, and details on the variables for which there are missing data.
Table 1: Indicators by Data Source
*Number = the count of indicators included in the category referenced in the row.
By Data Source:
Freedom House (2)
Political Rights and Civil Rights: Collected by Gui Russo from the Freedom House website.[1] These indicators are updated every year, and range from 0 to 40 and 0 to 60, respectively.
LAPOP (6)
Personal Empowerment, Government Responsiveness, and Community Participation (Gender and Race):
These data are from the 2014-2015 AmericasBarometer round.[2]
Woman’s Rights (1)
These data are provided by Joan Caivano and Jane Marcos-Delgado, and are updated every year.
LGBT Rights (1)
This is now called LGBT Friendliness because of the inclusion of a new component from public opinion data. These data are provided by Javier Corrales, and are updated every year.
The Public Opinion score in the Gay Friendliness indicator 2016 is calculated based on the AmericasBarometer 2014-2015 round conducted by the Latin American Public Opinion Project (LAPOP). To generate the score, we used the surveys to estimate the average tolerance toward homosexuals having the right to run for public office (D5) and the right to marry (D6), and added these together and divided by two. Then, we categorized the countries’ scores into three groups: High Support (1), Moderate Support (0.5), and Low Support (0).
To divide countries into these groups, we used cut-off points based on the standard comparative graphs presented by LAPOP’s reports. Instead of using the original scale presented in the questionnaire item, LAPOP uses a numerical transformation (in this case, from 1-10) into a “0-100 points scale”. By way of the numerical transformation, a score of 40 points in the 0-100 scale would be equal to 4.6 on the original 1-10 scale, and 50 would be 5.5. After setting the cut-off points, points were attributed to countries according to their scores.
This coding procedure can also be presented as follows:
X= [(Average of D5+1) * 100 / 9] + [(Average of D6+1) * 100 / 9]
If X < 4.6, Public Opinion score= 0,
If X ≥ 4.6 and <5.5, Public Opinion score= 0.5,
If X ≥ 5.5, Public Opinion score= 1
Ethnoracial Indicator (1)
This indicator uses the same numbers as last year’s Index, which was partially provided by the IDB and partially collected by AQ.
UNDP Social Expenditure (1)
Expenditure on Social Programs:
Collected by Gui/LAPOP from the World Bank Online Databank,[3] with numbers provided by UNDP. This indicator uses last available numbers for each country.
World Bank (8)
Secondary School Enrollment, Adequate Housing, Moderate Poverty, Access to a Formal Job (Gender and Race):
These data were provided directly by the World Bank based on national household surveys.
IMF (1)
Average of change in GDP, constant prices:
Collected by Gui Russo from the IMF website.[4] This indicator is updated every year, but the latest numbers are estimated for some countries.
FINDEX (1)
Account at a financial institution (Gender):
Collected by Gui Russo from the Global Index website.[5] This indicator uses the same numbers as from last year’s Index.
Literacy Rates (1)
This is a new indicator included in the 2016 Social Inclusion Index. The data was collected by Gui Russo from the World Bank Online Databank. This uses last available data from 2010.
Table 2: Variables with Missing Information
[1] https://www.freedomhouse.org/reports
[2] http://www.vanderbilt.edu/lapop/
[3] http://data.worldbank.org/
[4] http://www.imf.org/en/Data
[5] http://www.worldbank.org/en/programs/globalfindex
Description of the main changes in AQ’s 2016 Social Inclusion Index
The most impactful change in the 2016 Index was the scoring method per indicator. In the previous years’ approach for calculating the final scores, which we will term “Point-Score” approach, countries were first ranked in each individual indicator and given a point-score with increments of 1 starting from 1 (lowest) to the maximum number according to the number of countries. For example, we collected Freedom House scores for 17 countries in 2016, the country with the largest Civil Liberties score was Uruguay, which would have received 17 points. The country with the lowest score was Honduras, which would have received 1 point. The limitation with this approach is that it over-states differences between countries at the top versus those at the bottom. That is, Uruguay received 17 times the number of points of Honduras, when in reality, the difference between the scores was only slightly more than 2 times larger.
Table 1: Distribution of Points in the SI 2016 by Freedom House Civil Liberties scores[1]
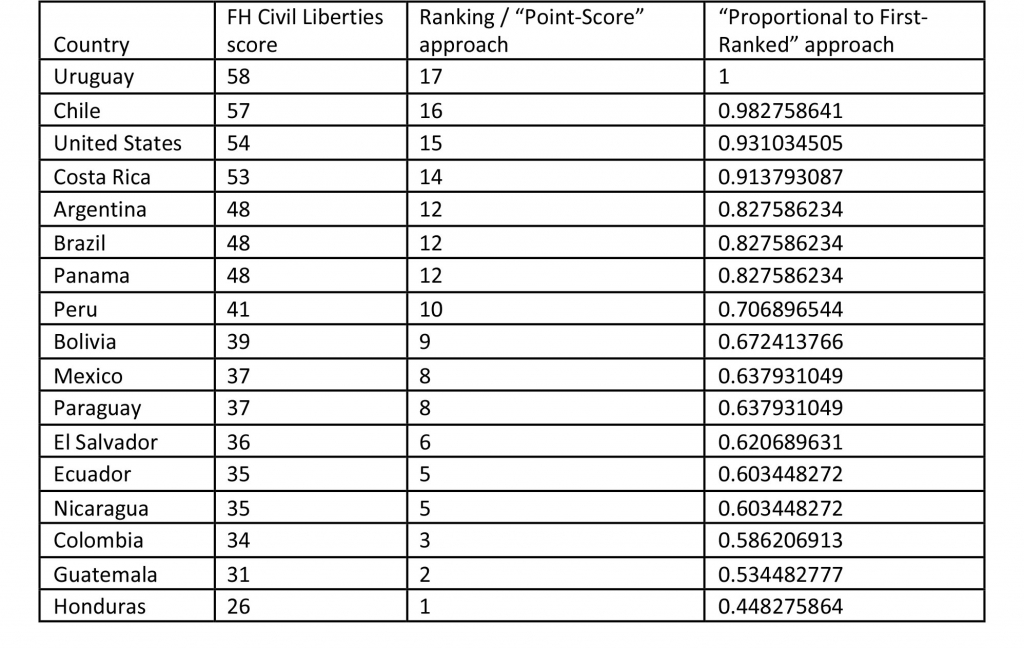
Instead of attributing points according to the indicator’s ranking, this year we used a “proportional to the first-ranked case” approach, in which the indicator’s top country is used as reference (100%), and the other countries receive points proportionally to their differences. See last column of Table 1. This method does not change any of the individual indicator rankings, but may affect the final rankings because it respects the size of differences and gives points per indicator in a “fairer” fashion. That is, instead of artificially setting a difference of 1 point between countries, this method uses the true variation in scores to attribute the points that go into the final calculation.
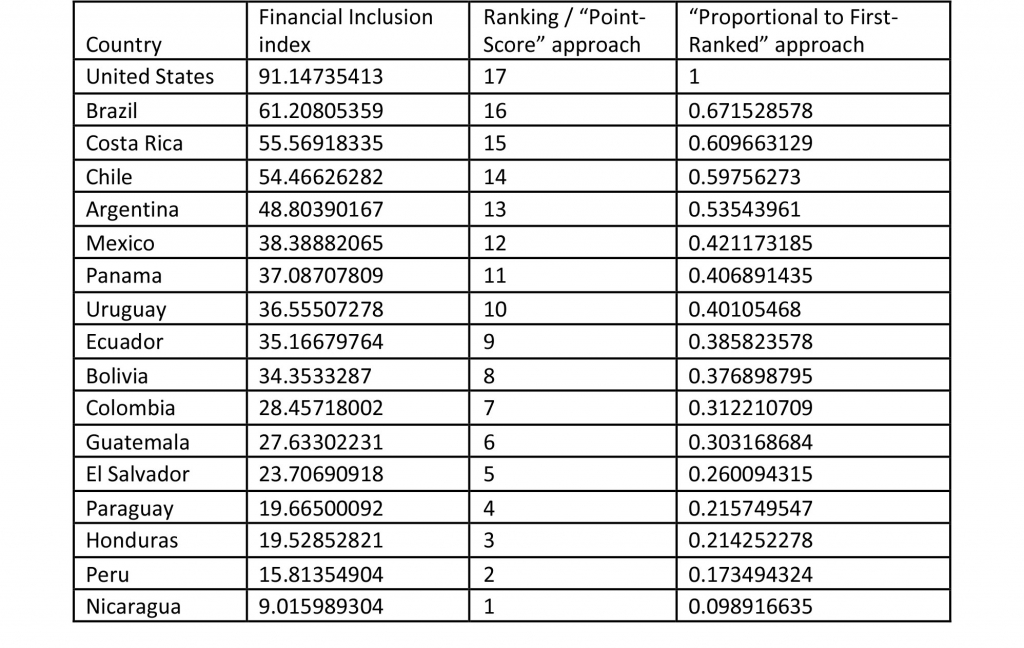
While on one hand the “Point-Score” tends to inflate the size of the gap between the top- and the bottom-ranked countries, it may also reduce differences in the top given the second country from the top will always have, at least with 17 countries, 94.12% (16/17) of the points received by the first, even if their difference was much larger than that. For example, in the case of the FINDEX score, Brazil (2nd) could have been arguably given a higher than warranted score simply by being second in the ranking (despite a large difference from first place United States); see Table 2.
Table 2: Distribution of Points in the SI 2016 by Financial Inclusion Index scores
Countries that are traditionally in the bottom of the Index particularly benefited from the change in calculation. For example, Guatemala more than doubled its final score, while not substantially improving its indicators. In sum, the new approach to attributing points by indicator does not change the rankings of individual indicators, but leads to an impact on the final scores of countries in the bottom without leading to dramatic fluctuations in the final ranking. That is, in spite of the large bump in final scores Guatemala and other countries in the bottom received, these changes did not alter their positions in the final rankings, as presented in Table 3.
Table 3: Final Rankings in 2015 and 2016 SIs
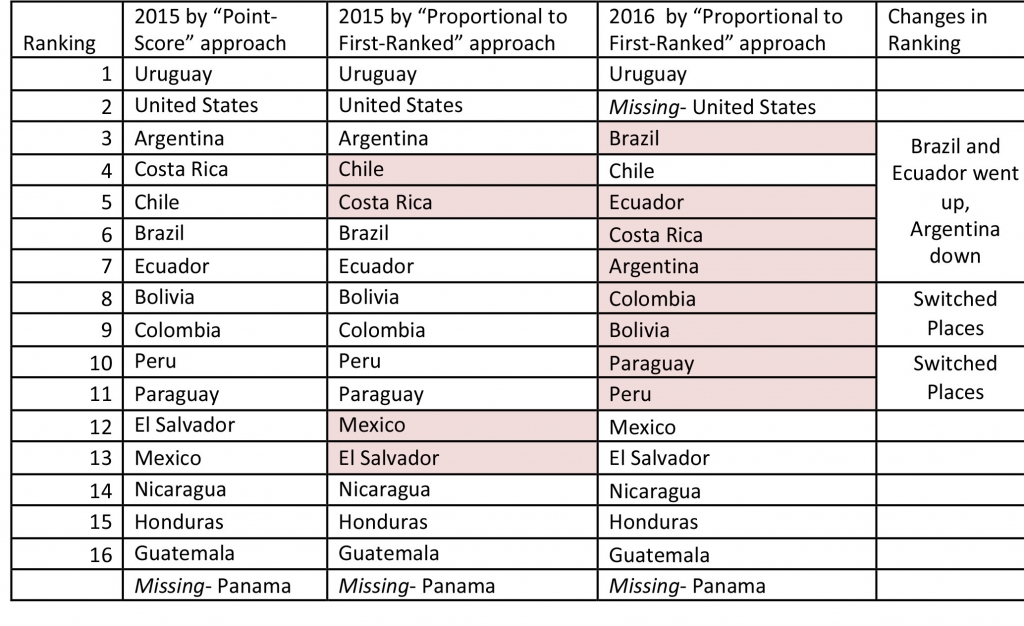
The change in approach largely explains why Ecuador went up in the final ranking. Ecuador was in “the middle” of many indicators, and had systematically received fewer points due to the calculation approach. For example, Ecuador ranks 9 out of 15 in Adequate Housing (60% in the “Point-Score” approach), but in fact Ecuador has almost 91% of its population with adequate housing, which compared to the top-ranked country Costa Rica (98.3% population with adequate housing) means Ecuador receives a score of 92.4% when using the “Proportional to First-Ranked” approach.
Other reasons why Ecuador and especially countries in the bottom improved their final scores compared to last year are 1) the exclusion of the U.S., 2) the inclusion of LAPOP’s three public opinion indicators by race, and 3) the slight change in the coding of woman’s rights. First, because the U.S. was often on top of the rankings; by not including it this year, countries became closer to the top and received higher scores with the proportional system. An example is the Financial Inclusion Index score in which the U.S. had a large lead over other countries. Second, because the three new indicators (LAPOP race) have smaller differences (smaller deviation) across countries and public opinion scores do not highly correlate with development indicators, their inclusion led to a boost for poorer countries. Thirdly, because it was not clear which three laws were being used in the Violence against Women component of the Women’s Rights indicator, we decided to use the score of all 15 laws, which also slightly benefited Ecuador. However, Ecuador’s jump may appear as more dramatic than it really is. Ecuador was relatively close to the second tier group (Costa Rica, Chile, Brazil) in the 2015 Index. In this year’s Index, it is ahead of Costa Rica and Argentina, but only by a small margin; see Table 4.
Table 4: Final Ranking and Scores in the 2016 SI
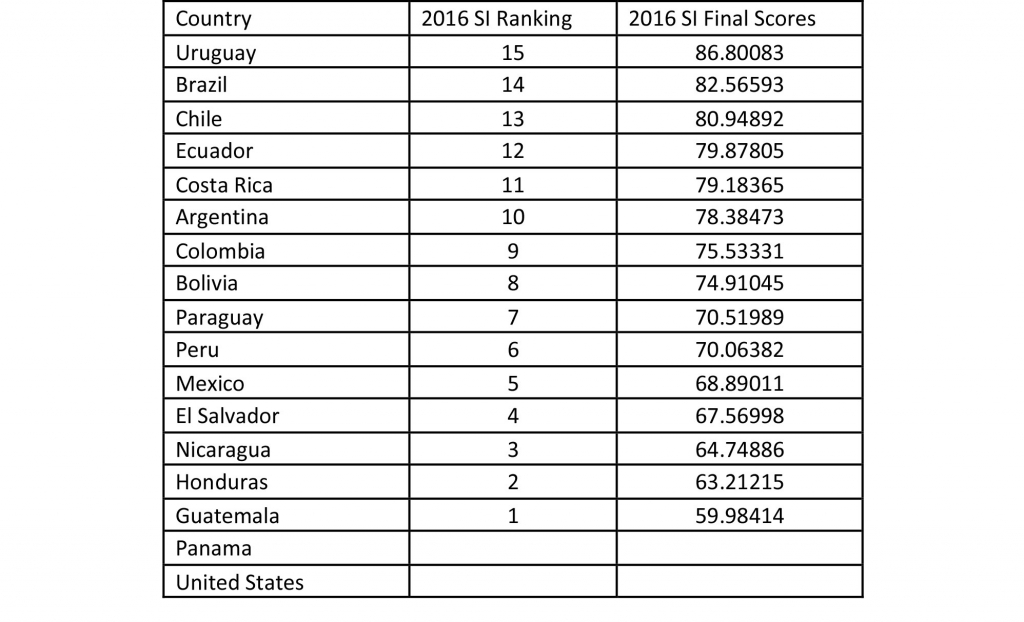
Argentina and Brazil also experienced position changes in this year’s Index. Their movement is also principally explained by the changes in the point-attributing approach and the drop of the U.S., and not so much by substantial transformations in their actual indicators.[2] However, it is important to note again that the differences between Brazil, Chile, Ecuador, Costa Rica and Argentina are relatively small. We can think of these countries as belonging to a second-tier group that trails behind Uruguay, but is substantially better off than other South American countries and Mexico and the other countries in Central America.
[1] The U.S. and Panama are shown here, but are not considered when calculating this year’s final scores.
[2] It should be noted, however, that Brazil’s 2016 numbers on Secondary Enrollment were improved by roughly 10% when compared to 2015.