
The Politics of Diversity
by Leani GarcíaHow well do the region’s legislatures reflect the people they represent? While women make up slightly more than half of the population in the Americas, they comprise only 28 percent of legislatures. The numbers are even bleaker when it comes to ethno-racial minorities. Of the countries where data was available, only Peru and Canada have representation proportionate to their Afro-descendant and indigenous populations, respectively. Most national governments don’t even track how many legislators are members of visible minority groups. Despite both gender and ethnoracial quotas for the legislatures in many countries, a lack of representation continues to hinder social inclusion throughout the region.
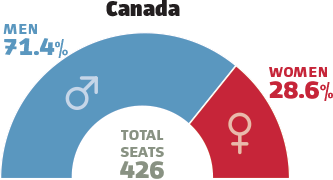
Percentage of Seats in national legislatures
(by gender)
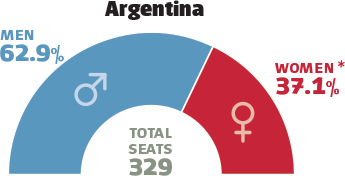
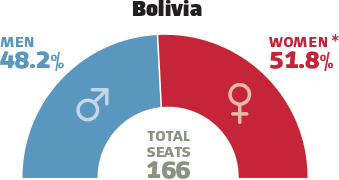
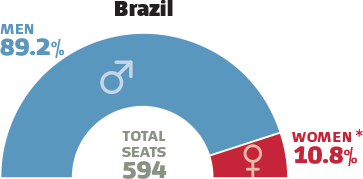
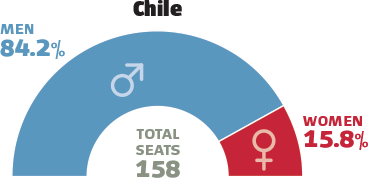
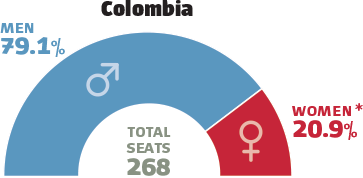
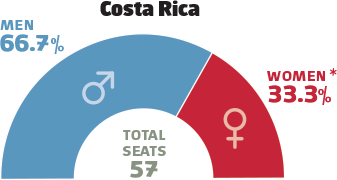
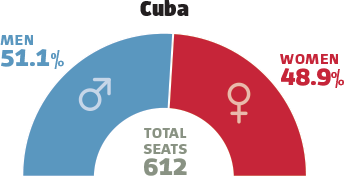
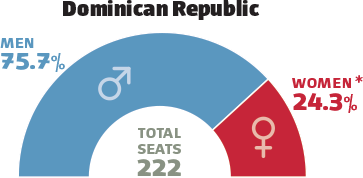
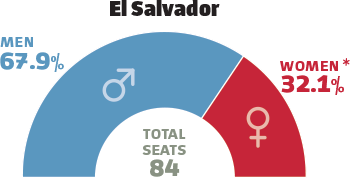
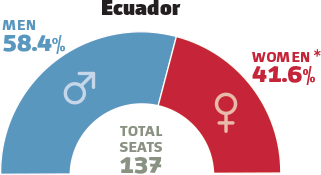
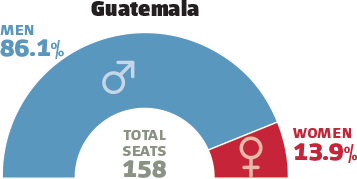
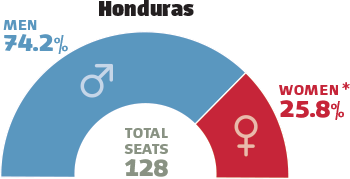
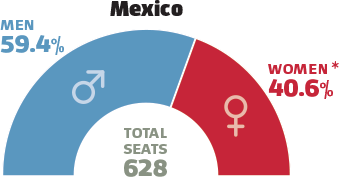
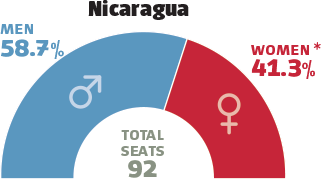
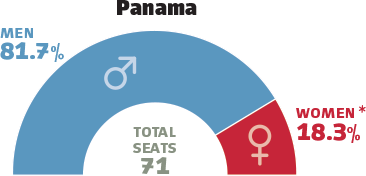
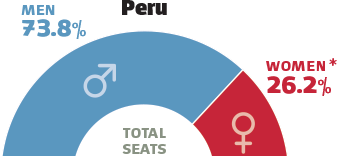
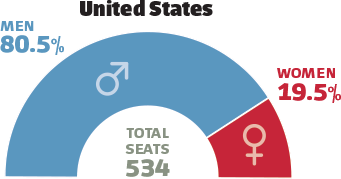
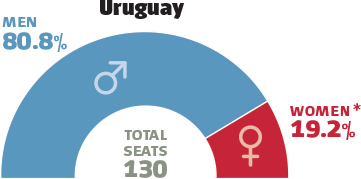
*Denotes country with nationally legislated quota.
years of data: Gender (2016); Ethnoracial minority seats (2014); Population (2006-2012).
notes: For legislatures with two chambers, the seats have been combined. The percentage of Afro-descendant legislators in Latin America compiled by Mala Htun, professor of political science at the University of New Mexico, by coding legislator photos for all except Brazil, which she compiled from Universo Online’s “Congresso em foco” and Electoral Court official data. Percentage of indigenous legislators compiled by Htun by coding (Ecuador and Venezuela) and country-specific secondary sources (Bolivia, Brazil, Chile, Colombia, Guatemala, Mexico and Peru). Percentage of Afro-descendant and indigenous populations
in Latin America compiled by Edward Telles from national
census data; LAPOP (Chile, Dominican Republic and Mexico)
and the Inter-American Development Bank (Paraguay).
SOURCES: Inter-Parliamentary Union; Congressional
Research Service; Parliament of Canada; United States
Census Bureau; Statistics Canada; Mala Htun, Inclusion
without Representation in Latin America (Cambridge
University Press, 2016); Edward Telles, Pigmentocracies:
Ethnicity, Race, and Color in Latin America (UNC Press, 2014).
Percentage of Seats & Population (by race)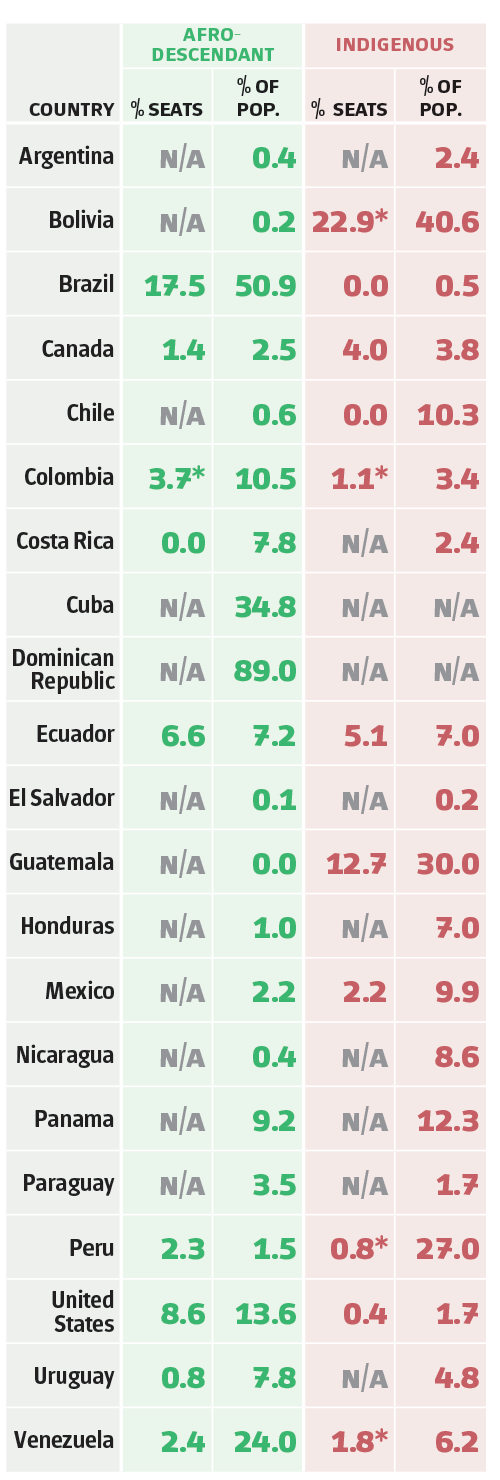
*Denotes country with nationally legislated quota.
years of data: Gender (2016); Ethnoracial minority seats (2014); Population (2006-2012).
notes: For legislatures with two chambers, the seats have been combined. The percentage of Afro-descendant legislators in Latin America compiled by Mala Htun, professor of political science at the University of New Mexico, by coding legislator photos for all except Brazil, which she compiled from Universo Online’s “Congresso em foco” and Electoral Court official data. Percentage of indigenous legislators compiled by Htun by coding (Ecuador and Venezuela) and country-specific secondary sources (Bolivia, Brazil, Chile, Colombia, Guatemala, Mexico and Peru). Percentage of Afro-descendant and indigenous populations
in Latin America compiled by Edward Telles from national
census data; LAPOP (Chile, Dominican Republic and Mexico)
and the Inter-American Development Bank (Paraguay).
SOURCES: Inter-Parliamentary Union; Congressional
Research Service; Parliament of Canada; United States
Census Bureau; Statistics Canada; Mala Htun, Inclusion
without Representation in Latin America (Cambridge
University Press, 2016); Edward Telles, Pigmentocracies:
Ethnicity, Race, and Color in Latin America (UNC Press, 2014).

